 Asian Economy: Facts and Figures
by Syarif Hidayat*
Asian Development Bank (ADB)’s Asian Development Outlook (ADO) 2015 projects that Developing Asia will grow at a steady 6.3% in 2015 and 2016, supported by a strengthening recovery in the major industrial economies and soft global commodity prices.
The drop in international oil prices is taking pressure off of consumer prices. Inflation will slow from 3.1% in 2014 to 2.6% in 2015.
As low oil prices are supporting growth in developing Asia, a sudden sharp reversal could undermine the outlook and require policy response. Similarly, while capital inflows to the region have been beneficial for growth, policy makers must carefully manage credit expansion to ensure that it does not lead to excessive leverage and asset price bubbles.
Also Read: MUI Warns Government of Risks Behind Proposed Stabilization Force Deployment to Gaza
Developing Asia needs a deep, robust financial sector to sustain growth. Policy makers will be challenged to ensure that financial sector development is inclusive, providing broad access to households and firms. Financial stability must also be maintained to enhance growth and equity.
Developing Asia is expected to extend its steady growth. The region’s growth is projected to edge up from 6.1% in 2013 to 6.2% in 2014 and 6.4% in 2015. Moderating growth in the People’s Republic of China (PRC) as its economy adjusts to more balanced growth will offset to some extent the stronger demand expected from the industrial countries as their economies recover.
Risks to the outlook have eased and are manageable. The monetary policy shift in the United States (US) may invite some volatility ahead in financial markets, albeit mitigated by accomodative monetary policy in Japan and the euro area. The regional growth outlook depends on continued recovery in the major industrial economies and on the PRC managing to contain internal credit growth smoothly.
Widening income gaps in developing Asia strengthens the case for greater use of fiscal policy to foster equality of opportunity. While the region has benefited from fiscal prudence in the past, demographic and environmental challenges are expected to compete for public resources in the coming years. To boost public spending on equity-enhancing programs such as education and health without undermining fiscal sustainability, the authorities will need to explore a wide range of options for mobilizing revenue and to build equity objectives into their fiscal plans.
Also Read: Prof. El-Awaisi: The Mandate to Liberate Al-Aqsa Began at Prophethood
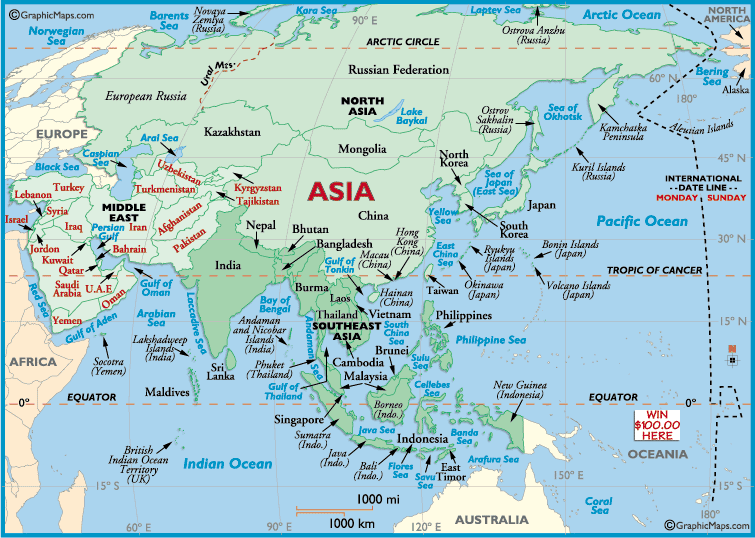
The Economy of Asia comprises more than 4.4 billion people (60% of the world population) living in 49 different states. Six further states lie partly in Asia, but are considered to belong to another region economically and politically. Asia is the fastest growing economic region and the largest continental economy by GDP PPP in the world.
China is the largest economy in Asia and the second largest economy in the world. Moreover, Asia is the site of some of the world’s longest economic booms, starting from the Japanese economic miracle (1950-1990), Miracle of the Han River (1961-1996) in South Korea and the economic boom (1978-2013) in China.
As in all world regions, the wealth of Asia differs widely between, and within, states. This is due to its vast size, meaning a huge range of different cultures, environments, historical ties and government systems. The largest economies in Asia in terms of PPP gross domestic product (GDP) are China, India, Japan, Russia, South Korea, Indonesia, Turkey, Iran, Saudi Arabia, Taiwan, Thailand, Pakistan, Malaysia and Philippines and in terms of nominal gross domestic product (GDP) are China, Japan, Russia, India, South Korea, Indonesia, Turkey, Philippines, Saudi Arabia, Taiwan, United Arab Emirates, Thailand, Iran, Malaysia and Singapore.
Wealth (if measured by GDP per capita) is mostly concentrated in the East Asian territories of Hong Kong, Macau, Japan, South Korea, Singapore, Brunei, and Taiwan, as well in oil rich countries in West Asia such as Saudi Arabia, Qatar, United Arab Emirates, Bahrain, Iran, Kuwait, and Oman. Israel and Turkey are notable exceptions: both lie in the territory of Asia despite not often being counted as such, and are also extremely wealthy nations and powerful economies. Asia, with the exception of Japan, South Korea, Taiwan, Hong Kong and Singapore, is currently undergoing rapid growth and industrialization spearheaded by China and India, the two fastest growing major economies in the world.
Also Read: Mount Semeru Erupts, Trapping Dozens, Forcing Evacuations in East Java
While East Asian and Southeast Asian countries generally rely on manufacturing and trade for growth, countries in the Middle East depend more on the production of commodities, principally oil, for economic growth. Over the years, with rapid economic growth and large trade surplus with the rest of the world, Asia has accumulated over US$4 trillion of foreign exchange reserves – more than half of the world’s total.
| Economy of Asia | |
|---|---|
| Statistics | |
| Population | 4.2 billion (60% of the world) |
| GDP | Nominal: US$18.515 trillion (2010) PPP: US$24.077 trillion (2010) |
|
GDP growth
|
Per capita: 7.9% (2010)[1] |
|
GDP per capita
|
Nominal: US$4,629 (2009) PPP: US$7,041 (2009) |
| 3.37 million (2011)[2] | |
| Unemployment | 3.8% (2010 est.) |
| Most numbers are from the International Monetary Fund.
All values, unless otherwise stated, are in US dollars.
|
|
2008-present
In 2008, the Global Financial Crisis, triggered by the housing bubble in the United States, caused a significant decline in the GDP of the majority of the European economies but have spared the Asian economies, when at the same time also experience slowdown in the economic growths, particularly Japan, South Korea, and China, only to pick up back in their normal high growths at the end of the year.
Also Read: President Prabowo Inaugurates UAE-Funded Emirates–Indonesia Cardiology Hospital in Solo
The Arab Spring since 2011 had caused economic malaise in Syria, Lebanon and Yemen, amongst the most adversely affected nations in the Middle East. At the same time, in early 2010s, Iraq, Saudi Arabia, the United Arab Emirates and Kuwait registered high GDP growths in the years that followed due to increased oil prices and further diversification of exports, as well as rising Foreign exchange reserves.
In 2013, in a once-in-a-decade party leadership reshuffle in China (change of Hu-Wen Administration to Xi-Li Administration), the Chinese economy experienced a significant slowdown in the GDP growth, slowing down from the unprecedented decades of 9-10% annual growth to around 7-8%, which has significant effect in some developing economies, particularly in Southeast Asia and India, excluding the Philippines, which managed to grow at rates at par with China in the period 2012-2013. Philippines has been recently affected by the Typhoon Haiyan, the strongest storm on record, in November 2013, killing at least 5,200 and displacing millions more, although the disaster has a minimal effect on the country’s economy by the dawn of 2014.
On September 29, 2013, China opened the Shanghai Free-Trade Zone. This free trade zone allows international trade to be conducted with fewer restrictions and lower customs duties. The zone is tax free for the first ten years to encourage foreign direct investment (FDI) with a ‘negative list’ used to regulate in which fields foreign investments are prohibited. The free trade zone allows for free exchange of the heavily regulated Chinese currency the yuan. Additionally, the zone provides financial support that benefits overseas investments for both individuals and business entities and opens the door for overseas financing which allows Chinese businesses to obtain foreign loans at lower interest rates.
Future
Asia’s large economic disparities are a source of major continuing tension in the region. While global economic powers China, Japan, India, and South Korea continue powering through, and Indonesia, Malaysia, Philippines, Thailand, Vietnam and Sri Lanka have entered the path to long-term growth, regions right next to these countries are in severe need of assistance.
Given the large number cheap and amply available labor in the region, particularly in China and India, where large workforces provide an economical advantage over other countries, the rising standard of living will eventually lead to a slow-down. Asia is also riddled with political problems that threaten not just the economies, but the general stability of the region and world. The nuclear neighbors—Pakistan and India—constantly pose a threat to each other, causing their governments to heavily invest in military spending.
Military intervention by the United States in Iraq and Afghanistan has also inflamed extremism and resulted in several terrorist attacks in a number of Asian countries. Another impending crisis is the depletion of oil reserves in the Middle East. Most of these economies have traditionally been over-dependent on oil and have had difficulty establishing another pillar in their economies.
Yet another potential global danger posed by the economy of Asia is the growing accumulation of foreign exchange reserves. The countries/regions with the largest foreign reserves are mostly in Asia – China (Mainland – $2,454 billion & Hong Kong – $245 billion, June 2010), Japan ($1,019 billion, June 2009), Russia ($456 billion, April 2010), India ($284 billion, July 2010), Taiwan ($372 billion, September 2010), the Republic of Korea ($286 billion, July 2010), Singapore ($206 billion, July 2010). This increasingly means that the interchangeability of the Euro, USD, and GBP are heavily influenced by Asian central banks. Some economists in the western countries see this as a bad thing, prompting their respective governments to take action.
Also Read: Indonesia’s Hajj Ministry Engages Local MSMEs to Strengthen Catering for 2026 Pilgrims
According to the World Bank, China may become the largest economy in the world sometime between 2020 and 2030, while India may become the second largest economy in the world sometime between 2030 and 2035.
Based on Hurun Report, for the first time in 2012 Asia surpassed North America in amount of billionaires. More than 40 percent or 608 billionaires came from Asia, where as North America had 440 billionaires and Europe with 324 billionaires.
Asian countries by GDP
This is a list of Asian countries sorted by their 2013 gross domestic product at market or government official exchange rates (nominal GDP) and PPP map is for year 2013.
Also Read: Indonesia Denies Being Destination for Forced Relocation of Gaza Residents
2013 Nominal GDP and PPP list by the International Monetary Fund (sortable; in billions of $US)
| Country or territory |
GDP nominal millions of USD |
GDP PPP millions of USD |
GDP PPP per capita USD |
Location |
|---|---|---|---|---|
| 20.736 | 35.146 | 1,150 | South Asia | |
| 10.547 | 20.352 | 6,191 | West Asia | |
| 73.537 | 102.811 | 11,044 | West Asia | |
| 32.215 | 40.610 | 34,584 | West Asia | |
| 161.76 | 496.00 | 3,167 | South Asia | |
| 1.985 | 4.745 | 6,370 | South Asia | |
| 16.214 | 21.690 | 53,431 | Southeast Asia | |
| 56.408 | 112.972 | 1,739 | Southeast Asia | |
| 15.659 | 39.690 | 2,576 | Southeast Asia | |
| 9,181.377 | 13,395.396 | 9,844 | East Asia | |
| 21.827 | 22.271 | 25,265 | West Asia | |
| 6.147 | 25.772 | 21,705 | Southeast Asia | |
| 16.162 | 27.552 | 6,145 | West Asia | |
| 273.658 | 381.918 | 52,722 | East Asia | |
| 1,870.651 | 5,069.158 | 4,077 | South Asia | |
| 870.275 | 1,292.848 | 5,214 | Southeast Asia | |
| 366.259 | 945.518 | 12,264 | West Asia | |
| 229.327 | 257.036 | 7,391 | West Asia | |
| 291.500 | 273.671 | 34,770 | West Asia | |
| 4,901.532 | 4,698.805 | 36,899 | East Asia | |
| 33.860 | 40.016 | 6,115 | West Asia | |
| 220.347 | 246.904 | 14,391 | Central Asia | |
| 28.000 | 40.000 | 1,900 | East Asia | |
| 1,221.801 | 1,666.755 | 33,189 | East Asia | |
| 185.319 | 154.460 | 39,706 | West Asia | |
| 7.225 | 14.733 | 2,611 | Central Asia | |
| 10.002 | 20.777 | 3,068 | Southeast Asia | |
| 44.318 | 66.318 | 14,845 | West Asia | |
| 22.100 | 18.470 | 59,451 | East Asia | |
| 312.433 | 525.698 | 17,748 | Southeast Asia | |
| 2.276 | 3.086 | 9,173 | South Asia | |
| 11.516 | 17.064 | 5,885 | East Asia | |
| 19.341 | 42.112 | 1,508 | South Asia | |
| 80.571 | 94.986 | 29,813 | West Asia | |
| 238.737 | 575.049 | 3,149 | South Asia | |
| 15.973 | 19.828 | 2,834 | Southeast Asia | |
| 272.018 | 643.01 | 6,597 | Southeast Asia | |
| 202.651 | 199.638 | 98,814 | West Asia | |
| 2,118.006 | 2,556.203 | 17,884 | North Asia | |
| 745.273 | 937.163 | 31,245 | West Asia | |
| 295.744 | 348.700 | 64,584 | Southeast Asia | |
| 65.833 | 135.979 | 6,531 | South Asia | |
| 59.633 | 105.324 | 5,108 | West Asia | |
| 489.213 | 929.495 | 39,767 | East Asia | |
| 8.497 | 19.142 | 2,354 | Central Asia | |
| 387.156 | 673.725 | 9,874 | Southeast Asia | |
| 827.209 | 1,174.229 | 15,353 | West Asia | |
| 40.569 | 54.246 | 9,510 | Central Asia | |
| 396.235 | 272.027 | 30,122 | West Asia | |
| 56.476 | 113.755 | 3,762 | Central Asia | |
| 170.565 | 359.796 | 4,012 | Southeast Asia | |
| 39.152 | 61.752 | 2,316 | West Asia |
(T/P3/P2)
Mi’raj Islamic News Agency (MINA)
 *Senior Editor of Mi’raj Islamic News Agency (MINA) (He can be contacted via emails: [email protected] and [email protected])
Also Read: Indonesian Humanitarian Alliance Urges President Prabowo to Take Role in Sudan Crisis
Bibliotheque:
1.International News Agencies
2.International Online Media Information
3.International Monetary Fund (IMF) Reports
4.World Bank Reports
5.Asian Development Bank (ADB) Reports
6.The UN reports
Also Read: Indonesia Welcomes UN Security Council Resolution on Gaza


![Israeli tanks and APC’s gather by the Israeli – Lebanese border. Amid Israel’s escalating campaign against Hezbollah in Lebanon on September 30, 2024. [Erik Marmor/Getty Images]](https://en.minanews.net/wp-content/uploads/2024/10/IMG_20241001_203226-300x197.jpg)


 Mina Indonesia
 Mina Arabic